Written by Lukas Vermeer, Kevin Anderson, and Mauricio Acebal.
Sample Ratio Mismatch (SRM) checks can help detect data quality issues in online experimentation. Not all experimentation platforms provide these checks as part of their solution. Users of these platforms must therefore manually check for SRM, or rely on additional processes—such as checklists—or automation.
To ensure reliable and early detection of SRM, we wanted to automate the detection and analysis of SRM in experiments running on third-party experimentation platforms. We built a set of Looker dashboards to facilitate self-serve SRM detection and root cause analysis. In addition, we added email and chat-based alerting to pro-actively inform experimenters of SRM and guide them towards these dashboards when needed. As a result, several cases of SRM have been detected and experimenters have been warned. Bad decisions based on flawed data were avoided.
In this post, we show that SRM checks are relatively straightforward to automate and can be useful for data quality monitoring even for companies who rely on third-party experimentation platforms. Pro-active alerting—rather than passive reporting—can reduce time to detection and help non-experts avoid making decisions based on biased data. We provide a real-world example as an illustration.
Why we started this project
At Vista, we want to run (online) controlled experiments at a large scale comparable to other well known online companies. We want to make our experimentation flywheel spin faster so that more people can get more value from experiments. This involves many non-experimentation-experts setting up and executing these experiments in a self-service manner.
We also want our experiments to be trustworthy, without creating knowledge or process bottlenecks. Although we will partially rely on checklists such as those suggested by Fabijan et al. 2019 as well as a structured education curriculum, we are also investing in automation and infrastructure to improve the consistency and reliability of our data quality checks.
One such data quality check is the Sample Ratio Mismatch test. While this test requires only summary statistics from experiments and is relatively straightforward to perform, it can help uncover a wide variety of data quality issues. This makes it a good candidate for one of the first data quality mechanisms to automate.
How we implemented these checks
Before embarking on this project, some of us were using the SRM Checker Chrome plugin which flags SRM issues in one of the third-party experimentation platforms we are using. This approach had several downsides compared with our automation:
- It can only warn experimenters who have the plugin installed. Since not all experimenters have the plugin installed, data quality monitoring was inconsistent between teams.
- It has limited support for platforms. Since not all experimentation platforms in use at Vista are supported, data quality monitoring is inconsistent between platforms.
- It can only warn the user about issues when they actively check the experiment results. In some cases, this led to SRM issues going unnoticed for weeks, because nobody with the plugin installed was actively checking the results.
To ensure consistent and reliable detection of SRM issues—and to reduce opportunity costs as a result of late detection of SRM issues—we decided to automate SRM checks with the aim of pro-actively notifying experimenters within a day when they occur. Our approach makes use of several (third-party) infrastructure components which were already in place.
- An events pipeline (Segment) was used to collect triggering events when a user enters an experiment.
- A data lake (Snowflake) was used to store these triggering events—as well as experiment metadata from the experimentation platform—and allows us to create views and tables on top of this data.
- A reporting tool (Looker) that could be used to build reports and compute summary statistics from the data lake.
Using these components, we built four things.
- A Snowflake table that exposes how many visitors were triggered into each variation of each experiment.
- A Snowflake table that exposes the percentage of traffic allocated to each variation of each experiment in the experimentation platform settings.
- A Looker dashboard that performs a chi-squared test for each experiment in the above tables and displays a list of experiments that fail the SRM check.
- A Looker dashboard that performs a chi-squared test for different user segments of a particular experiment in the above tables to detect SRM within specific segments. The specific experiment is configurable as a dashboard parameter.
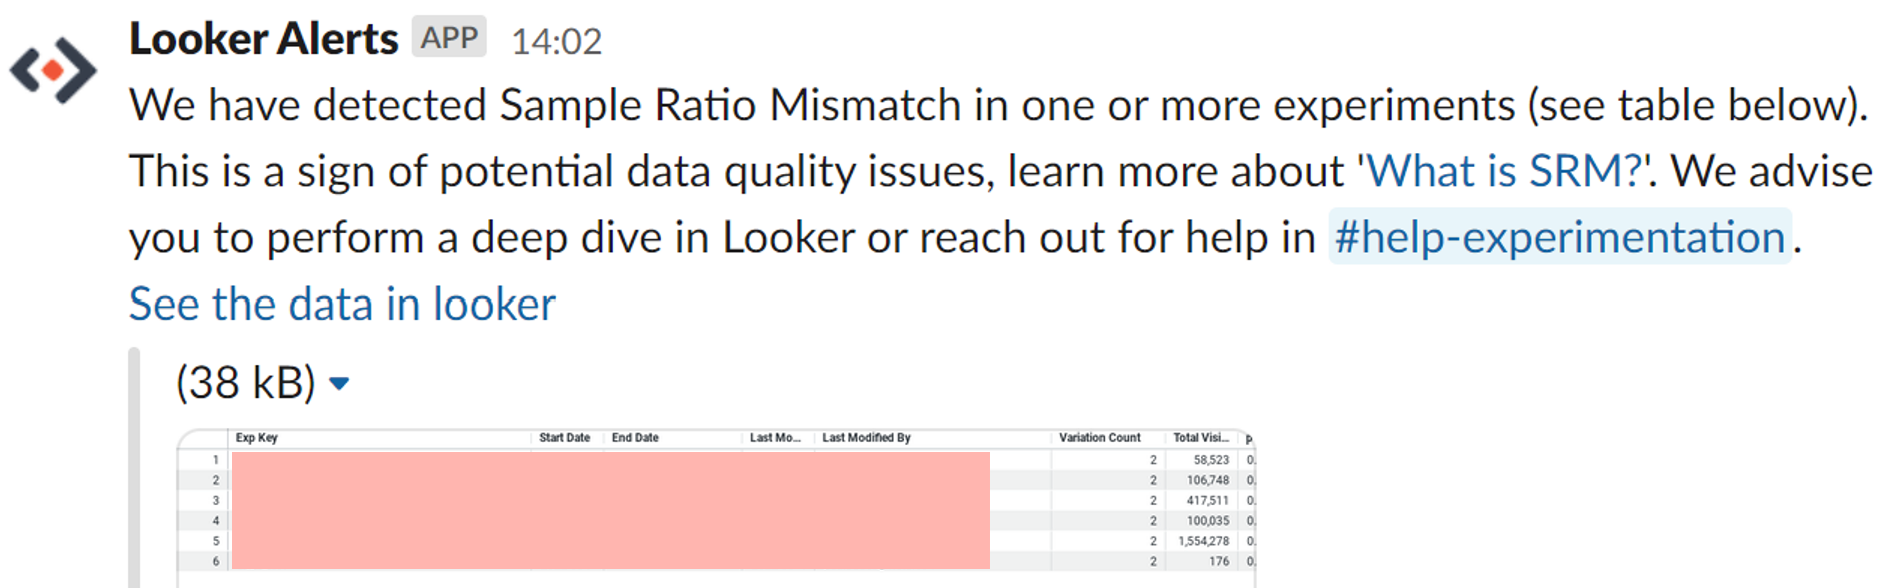
Looker allows us to schedule reports and send alerts when results are found (in our case a p-value lower than 0.01). We built a custom webhook (using AWS Lambda) that receives these results from Looker and builds more elaborate messages. We use this functionality to proactively inform experimenters via workplace communication tools in two ways.
- Once per day, we push a notification to a public Slack channel with a list of all experiments which failed the SRM check.
- Once per day, we send an email to the designated owner of any experiment which fails the SRM check.
An illustrative example
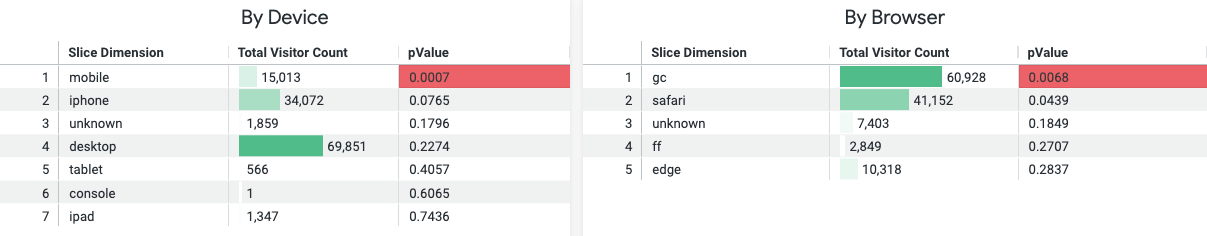
One of the first experiments to trigger the new alerts was making changes that unexpectedly affected page performance, especially on mobile devices. Our experimentation platform relied on client-side logic to trigger users into this particular experiment. Since page performance was affected, this also affected the time elapsed before this triggering logic was executed. This gave users more time to exit the page before the triggering event was fired. The resulting increase in data loss rate resulted in an SRM.
The owners of the experiment were informed of the SRM the next day and provided with a link to the root cause analysis dashboard. Because mobile devices were one of the segments offered, the root cause was quickly identified, saving precious analyst and developer time. The experiment could be stopped and the triggering issue addressed almost as soon as the SRM became apparent, again saving precious time.
In this example, the experiment owners were not previously aware of the importance of SRM checks. They also had not considered the potential impact of page performance on their triggering logic. The pro-active notifications thus provided several learning opportunities for these experimenters; all without the need for the experimentation hub team to take action or be involved. We believe these checks will provide a highly scalable approach to creating more of these learning opportunities for our users in the future.
Conclusion and next steps
Although we are getting immediate value from the current implementation by detecting and reducing the impact of SRM issues, our current approach to detection and analysis is deliberately rather basic. We see several potential areas of improvement in this first iteration of our checks.
- Our SRM checks are repeated daily. To mitigate alpha inflation as a result of multiple testing, we could apply the SSRM approach described in Lindon 2020 instead of our current fixed horizon test.
- We currently support only a few dimensions on our SRM analysis dashboard. These dimensions were chosen based on the causes of prior occurrences of SRM. If we consistently find SRM from other causes, we should add ways to identify those other causes more easily.
- Our analysis dashboard allows experimenters to self-serve and investigate, but it does not guide experimenters in any way. We could improve our pro-active notification system by automatically identifying segments of interest and including those findings in the notification text (e.g. “possible SRM detected in Chrome audience”).
- Because the third-party platform we use does not detect SRM, it will continue to report results even when they are likely biased. As a result, we run the risk of experimenters ignoring the SRM warnings and drawing invalid conclusions. We should guard against this, either through process controls or additional tooling around the third-party reporting.
- In addition, this project has proven the feasibility and usefulness of building data quality checks on top of existing third-party experimentation platforms when those platforms do not already perform such checks. We could extend this idea beyond SRM checks and implement additional monitoring capabilities, for example taking guidance from Fabijan et al. 2019 or Perrin 2021.
Acknowledgments
We would like to thank the other members of the Vista Experimentation Hub for their support in implementing the features outlined in this post. We would also like to thank the wider experimentation community for the experiment which served as an example. This post was based on a paper recently published and presented at the 2022 International Conference on Evaluation and Assessment in Software Engineering (EASE). There is also a version available for personal use.