
It takes a flywheel to fly
Kickstarting and keeping the A/B testing momentum
Written by Aleksander Fabijan (Mircosoft), Benjamin Arai (Microsoft), Pavel Dmitriev (Outreach.io), and Lukas Vermeer (Booking.com). Originally published on the Microsoft Experimentation Platform blog.
At the time when we published the Experimentation Evolution Model in 2017 [1], we never expected such an interest in it. Practitioners from hundreds of companies and several different industries reached out with thoughts, concerns and tips on how to kickstart and scale an A/B testing program from “Crawl” or “Walk” milestones, to the “Run” or “Fly” stages [1]. Without doubt, scaling A/B testing in an organization is a challenge with which all of us can empathize. The reason for this is that there is no easy path to achieve A/B testing at scale (i.e., “Fly” stage). The Experimentation Evolution Model has the right ingredients, yet what you cook with them and in what way determines how successful the evolution will be. To experience the full benefit of A/B testing, organizations need to evolve both technically and culturally, and this needs to happen in an iterative way. One of the best ways to describe this iterative path to “Fly” stage is by using a Flywheel.
What is a Flywheel?
The concept of a flywheel was presented in the book “Good to Great”, illustrating that good-to-great transformations never happen at once but, you guessed it, in turns [2]. Every flywheel consists of a few carefully derived steps that logically follow each other in a loop. The goal is to kickstart the flywheel to help it start moving. The intention is to reach enough momentum such that it continues to spin. Note that value can be derived from various outcomes; for example, confirmation that a change will or won’t improve the customer experience is not the only valuable learning to be derived from A/B testing on its own. In this article, we present the A/B Testing Flywheel — a tool for implementing and growing a successful A/B testing program. Our flywheel focuses on navigating the value-investment cycle which supports and motivates the continued funding required to scale up an A/B testing program.
Introducing the A/B testing Flywheel
We developed the A/B Testing Flywheel based on our experience and learnings from introducing and embedding A/B testing in over two dozen product teams at Microsoft (where Aleksander & Benjamin work), Outreach (Pavel), and Booking.com (Lukas).
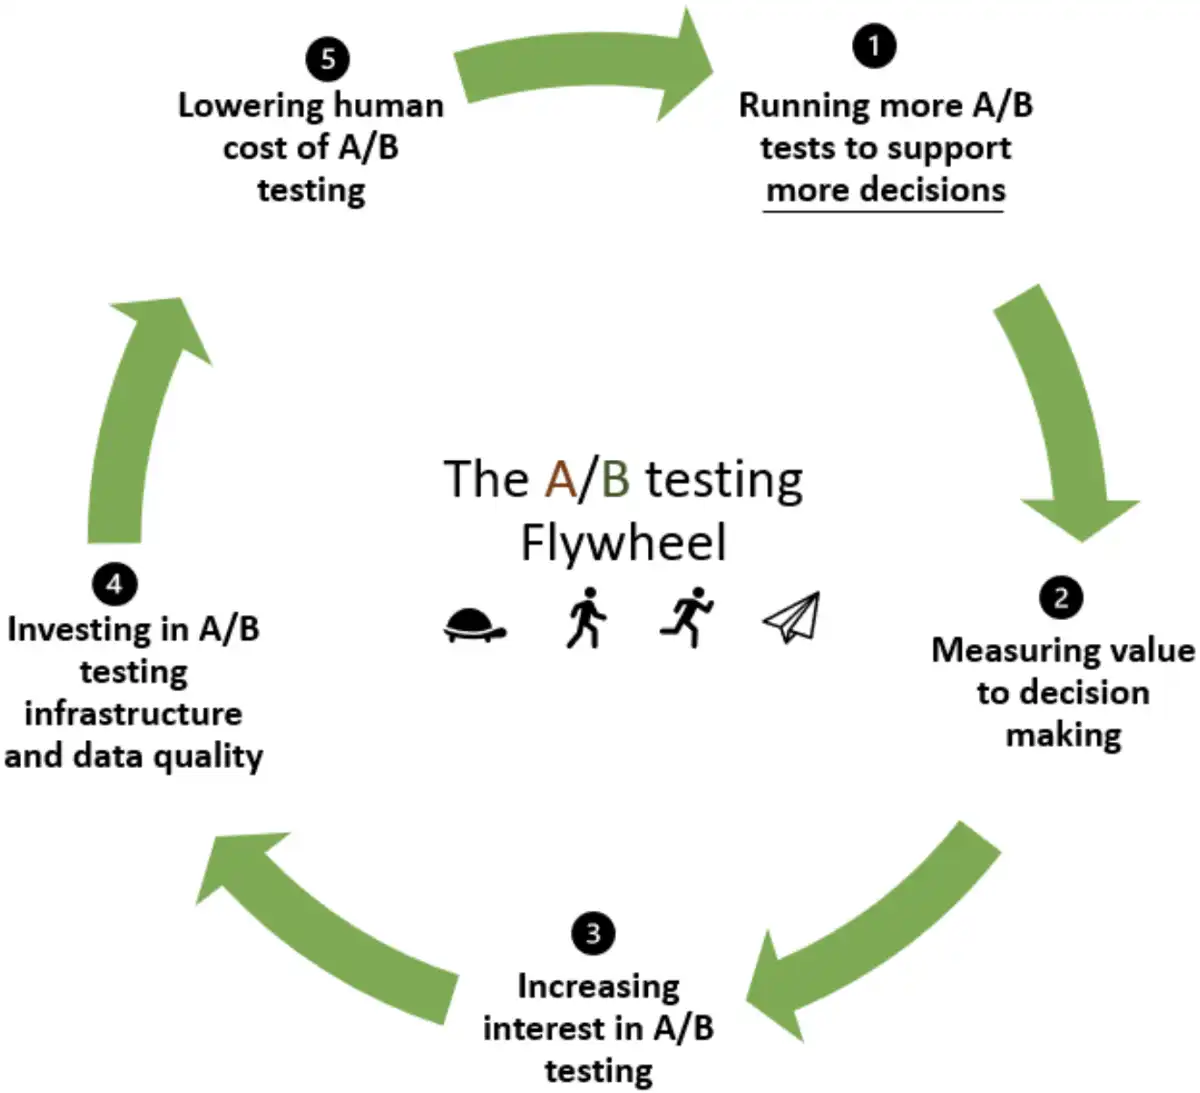
We refined it with insights extracted through surveys, tutorials, and other types of collaboration with companies that tried, failed, and succeeded in scaling their A/B testing culture. As you see from the figure, it consists of five steps that require continuous and iterative investment.
We introduce the steps next, starting with the goal-step of being able to support more decisions through A/B testing.
- Running more A/B tests to support more decisions. At the top of the flywheel is the goal — using A/B tests to support decision making. With every turn of the flywheel, we aim to run more A/B tests to support more decisions.
- Measure value to decision making. While not every A/B test has substantial impact on decisions, some A/B tests do, and the impact and value added by A/B tests need to be measured and captured. The more A/B tests we run with each turn of the flywheel, the more aggregate value and impact the A/B testing program will provide.
- Increasing interest in A/B testing. When A/B testing is ran by one team and those results are shared broadly, this can lead to interest in A/B testing by new teams and new A/B testing scenarios. To support this spread of interest, the value of A/B tests needs to be broadly communicated. Additionally, educational and support efforts are needed to support new teams interested in using A/B testing to ensure their initial experience with A/B testing is a success.
- Investing in A/B testing infrastructure and data quality. The more interest and willingness there is to try A/B testing within an organization, the more resources can be justifiably allocated to make an A/B testing program successful. These resources should be directed towards two key areas: improving A/B testing capabilities for managing and analyzing A/B tests, and increasing data quality. The goal of these investments is to make A/B tests are more trustworthy and easier to execute.
- Lowering human cost of A/B testing. Improvements in A/B testing infrastructure and data quality create conditions for streamlining the A/B testing process and lowering its human cost i.e., the amount of investment required to start doing A/B testing in a new area. Lowering the cost of A/B testing is a critical step in the flywheel that is often missed. If running A/B tests remains costly, A/B testing will remain limited to highly interested early adopters with a lot of resources. This step increases the return on investment (ROI) of A/B testing by reducing the “I” and making it worthwhile for more teams who may be less convinced about the “R” or are more resource constrained, to try running A/B tests.
Each of the steps above merits a thorough explanation that is beyond the scope of this article. Instead, we provide a few tips on how to make that first turn, and what keeps the Flywheel spinning once it’s on a roll (pun intended).
The first turn
An initial investment will be needed in each of the five steps of the A/B Testing Flywheel.
-
Running the first A/B test. The analysis of our data shows that the growth of A/B testing program often starts with a single team trying out A/B testing in one specific scenario, such as the signup flow on a website, or ranking optimization in a shopping app. In this initial stage, A/B tests need to be chosen wisely. Why? Well, initial success may quickly propel the A/B testing program forward, while failure may stop the program in its tracks before it had a chance to get going. Note that it is important to differentiate between the success of an A/B test and the success of an idea being tested. For example, an A/B test that correctly prevents rolling out a feature that regressed important metrics can be as valuable as an A/B test in which improvements were detected. We found the following factors to be important when selecting initial A/B tests:
-
High value potential. Focus on A/B testing features that have potential for high impact and relate to team goals. A/B tests on a small feature in an insignificant area of the website or product is unlikely to deliver significant value.
-
Simple to execute. Given the lack of A/B testing infrastructure at this stage, initial A/B tests should be as simple to configure and execute as possible. Extra complexities may result in issues with design, execution, and analysis of the A/B test, delaying results and undermining trust in A/B testing. For example, A/B tests requiring coordination across website and mobile app or coordination of several backend and frontend components should be avoided. As a rule of thumb, we recommend a simple A/B test with 1 treatment and 1 control, in a single component/area of the product, utilizing 100% of users split 50/50 to maximize sensitivity.
-
Easy to measure. The success metrics for the A/B test should be easily computable. Ideally, the product should already be instrumented, and data pipelines for metric computation should already exist. It is best to avoid creating new instrumentation and data pipelines at this stage and rather validate and reuse existing solutions. New infrastructure requires more time and resources and may introduce data quality issues.
-
-
Measuring value. Every successful A/B test that demonstrates clear value will push the flywheel forward, while every failure will slow or push it backward. Note that value can be derived from various outcomes; for example, confirmation that a change will or won’t improve the customer experience is not the only valuable learning to be derived from A/B testing. There is one specific type of value we have seen the most success with in terms of showcasing the power of A/B testing and generating more interest. We call this type of value a counterintuitive result. A counterintuitive result is a result of an A/B test that contradicts stakeholders’ expectations. To obtain a counterintuitive result, one needs to pick a test where the outcome is uncertain — there is a disagreement among the stakeholders about what they think the result will be. By choosing something over which there is disagreement, we are likely to choose something where insight has value. If stakeholders disagree about something, it’s probably something worth disagreeing about. For example, if there are several possible A/B testing ideas on the table, one can do a quick survey of decision makers asking them to predict the result and explain their prediction for each test. One should document the answers and then pick the test with the most disagreement. Once the results are in, someone is bound to be surprised!
-
Increasing Interest. If the A/B test was planned and executed correctly it will certainly result in learnings that will be of interest to many in the company. Review the results broadly (e.g., in a shiproom) and share them across the organization (e.g., in a newsletter). Make a game out of it before you share the outcome and measure how many predict the outcome of the A/B test correctly. Some teams like Azure Identity share broadly the variants that were tested and questions on which options received better outcomes [4]. Furthermore, at Microsoft we frequently organize Best Experiments Talks where A/B tests that resulted in valuable learnings are presented company-wide to inspire and spark interests in the scientific method.
-
Investing in Infrastructure. From an infrastructure perspective, we should focus on trustworthiness, especially in the early steps. One of the most fundamental components for running a trustworthy A/B test is treatment assignment — make sure that it is working correctly by running test A/As (A/B tests where both versions are identical) to validate your system end-to-end [5]. There is a small set of statistical tests necessary to interpret the results and ensure their trustworthiness. Before you run those, measure the observed split of users between variants and compare it to the configured one to detect a Sample Ratio Mismatch which commonly invalidates the results [6].
-
Lowering the cost. To lower the cost for the next A/B test, start automating the fundamental data quality checks such as the Sample Ratio Mismatch [7] and make it easy to start an A/A test to validate new set-ups and new metrics [5]. Since A/B testing is based on trustworthy data, it is instrumental that teams do not have to do common data checks manually. And because we intend to iteratively improve over time, we need to put checks in place to ensure that improvements do not accidentally introduce problems. Another aspect of lowering the cost are shared libraries. Teams starting A/B testing will hugely benefit from a shared library for assigning units into variants and a common script for computing metrics and performing statistical tests. What cannot be automated in this stage (e.g. interpreting analysis data) should be supported through office hours or some other easily accessible channel.
Making the A/B testing Flywheel Spin
Now that we know how to make the first turn, we need to invest in keeping the momentum.
-
Running more A/B tests. Eventually, A/B testing should expand scenario wise (e.g., from testing changes on the web to mobile to backend) and from one team to the next one. It is valuable for new teams to have a role model, e.g., another team which runs “similar A/B tests” and is successful. Another great way to facilitate the growth of A/B testing in a new area is to transition people with expertise in A/B testing to work with a new org. This is particularly powerful at the executive level, as it can greatly speed up A/B testing growth by making available resources that normally would only become available at the later stages of A/B testing growth.
-
Measuring more value. While the practice of collecting and communicating counterintuitive results should be continued, the focus of value creation needs to shift to connecting test results to business and customer value. Such connection is established by developing good Overall Evaluation Criteria (OEC) — a set of metrics and decision criteria used to judge the outcomes of A/B tests — which is predictive of long-term business and customer value and sensitive to the changes being tested. At this stage it is also important to focus on obtaining a more comprehensive understanding of test results by creating a richer set of metrics. In addition to a small set of OEC and Data Quality metrics that help determine whether the test was executed correctly and which variant is better, a comprehensive set of Local and Diagnostic metrics should be created [8], [9]. These metrics capture fine grained aspects of user behavior and often provide insight into the “why” behind the top level positive/negative result of an A/B test. Such insights help better understand user behavior, generate ideas for new features, and determine most promising focus areas within the product.
-
Increasing Interest even more. With more teams running A/B tests, a systematic program for communicating results and value needs to be created. For example, you can send monthly newsletters about interesting A/B tests that were completed, include A/B testing as part of new employee onboarding, share valuable learnings with executives, etc. The continuous supply and sharing of valuable A/B tests will reinforce the interest. Make sure to celebrate the learnings.
-
Investing in Infrastructure. A platform that has the capability to manage A/B testing operations will be instrumental for growth. We’ve extensively published about Microsoft’s Experimentation Platform (ExP) and features that are valuable for an A/B testing platform in our papers (see e.g. [10]–[12]) and hence will not go into the details here. Instead, what is important is that any steps that can be taken to reduce the need for manual intervention allows for decisions to be democratized and reduces the overall support cost.
-
Lowering the cost of A/B testing even more. Making the management of A/B tests and analysis consumption easy is critical for lowering the cost of A/B testing at scale. A/B tests should be easy to configure and iterate on (e.g. some might not even require code changes), and results intuitive to practitioners that might not be statisticians. Keep in mind that the tools need to be trustworthy as well as the decisions made based of them. Color coding and summarization results are two such examples that help with the interpretation [13]. Investing in ways to guide analysis through summarization of experiment result will drive down support costs and increase the trustworthiness of decisions making.
Steps in this flywheel allowed Microsoft, Outreach and Booking.com to scale A/B testing for many products in various stages of user growth, maturity in data pipelines and infrastructure, and the ability to adopt data-driven decisions. We hope that this iterative nature of the A/B testing Flywheel will be helpful to everyone else that strives to kickstart or grow their A/B testing program.
References
[1] A. Fabijan, P. Dmitriev, H. H. Olsson, and J. Bosch, “The Evolution of Continuous Experimentation in Software Product Development,” 2017, doi: 10.1109/ICSE.2017.76.
[2] J. Collins, “Good to great: Why some companies make the leap … and others don’t,” Meas. Bus. Excell., vol. 7, no. 3, pp. 4–10, 2003, doi: 10.1108/mbe.2003.26707cae.010.
[3] L. Peppler, “The Amazing Flywheel Effect,” 2019. .
[4] “Microsoft Identity sign-up flow A/B test.” https://twitter.com/azuread/status/1255957652976422914.
[5] “p-Values for Your p-Values: Validating Metric Trustworthiness by Simulated A/A Tests.” https://www.microsoft.com/en-us/research/group/experimentation-platform-exp/articles/p-values-for-your-p-values-validating-metric-trustworthiness-by-simulated-a-a-tests/.
[6] A. Fabijan, “Diagnosing Sample Ratio Mismatch in A/B Testing.” https://www.microsoft.com/en-us/research/group/experimentation-platform-exp/articles/diagnosing-sample-ratio-mismatch-in-a-b-testing/.
[7] A. Fabijan et al., “Diagnosing Sample Ratio Mismatch in Online Controlled Experiments,” in Proceedings of the 25th ACM SIGKDD International Conference on Knowledge Discovery & Data Mining — KDD ’19, 2019, pp. 2156–2164, doi: 10.1145/3292500.3330722.
[8] P. Dmitriev and X. Wu, “Measuring Metrics,” in Proceedings of the 25th ACM International on Conference on Information and Knowledge Management — CIKM ’16, 2016, pp. 429–437, doi: 10.1145/2983323.2983356.
[9] “Understanding Mechanisms of Change in Online Experiments at Booking.com.” https://booking.ai/understanding-mechanisms-of-change-in-online-experiments-at-booking-com-629201ec74ee.
[10] S. Gupta, L. Ulanova, S. Bhardwaj, P. Dmitriev, P. Raff, and A. Fabijan, “The Anatomy of a Large-Scale Experimentation Platform,” in 2018 IEEE International Conference on Software Architecture (ICSA), Apr. 2018, no. May, pp. 1–109, doi: 10.1109/ICSA.2018.00009.
[11] A. Deng, U. Knoblich, and J. Lu, “Applying the Delta method in metric analytics: A practical guide with novel ideas,” no. March, Mar. 2018, [Online]. Available: https://arxiv.org/abs/1803.06336.
[12] W. Machmouchi, S. Gupta, R. Zhang, and A. Fabijan, “Patterns of Trustworthy Experimentation: Pre-Experiment Stage,” 2020. https://www.microsoft.com/en-us/research/group/experimentation-platform-exp/articles/patterns-of-trustworthy-experimentation-pre-experiment-stage/.
[13] A. Fabijan, P. Dmitriev, H. H. Olsson, and J. Bosch, “Effective Online Experiment Analysis at Large Scale,” 2018.